(1059-B) Development of a high-throughput image cytometric screening method as a research tool for immunophenotypic characterization of patient samples from clinical studies
Senior Product Specialist Revvity Health Sciences, Inc. Lawrence, MA, United States
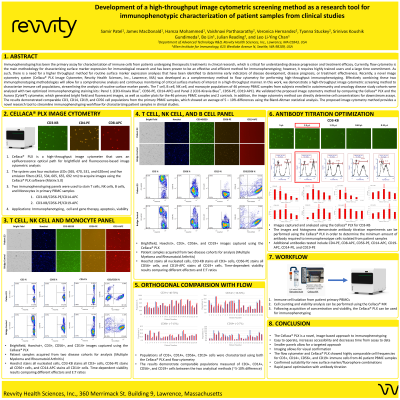
Abstract: Immunophenotyping has been the primary assay for characterization of immune cells from patients undergoing therapeutic treatments in clinical research, which is critical for understanding disease progression and treatment efficacy. Currently, flow cytometry is the main methodology for characterizing surface marker expression for immunological research and has been proven to be an effective and efficient method for immunophenotyping; however, it requires highly trained users and a large time commitment. As such, there is a need for a higher throughput method for routine surface marker expression analyses that have been identified to determine early indicators of disease development, disease prognosis, or treatment effectiveness. Recently, a novel image cytometry system (Cellaca® PLX Image Cytometer, Revvity Health Sciences, Inc., Lawrence, MA) was developed as a complementary method to flow cytometry for performing high-throughput immunophenotyping. Effectively combining these two immunophenotyping methodologies will allow for a comprehensive analysis and continuous monitoring of critical surface markers of interest in a high-throughput manner. In this work, we demonstrate a high-throughput image cytometric screening method to characterize immune cell populations, streamlining the analysis of routine surface marker panels. The T cell, B cell, NK cell, and monocyte populations of 46 primary PBMC samples from subjects enrolled in autoimmunity and oncology disease study cohorts were analyzed with two optimized immunophenotyping staining kits: Panel 1 (CD3-Kiravia BlueTM, CD56-PE, CD14-APC) and Panel 2 (CD3-Kiravia BlueTM, CD56-PE, CD19-APC). We validated the proposed image cytometry method by comparing the Cellaca PLX and the Aurora (Cytek®) cytometer, which generated bright field and fluorescent images, as well as scatter plots for the 46 primary PBMC samples and 2 controls. In addition, the image cytometry method can directly determine cell concentrations for downstream assays. The results demonstrated comparable CD3, CD14, CD19, and CD56 cell populations from the primary PBMC samples, which showed an average of 5 – 10% differences using the Bland-Altman statistical analysis. The proposed image cytometry method provides a novel research tool to streamline immunophenotyping workflow for characterizing patient samples in clinical studies.