Senior Product Specialist Revvity Health Sciences, Inc. Lawrence, MA, United States
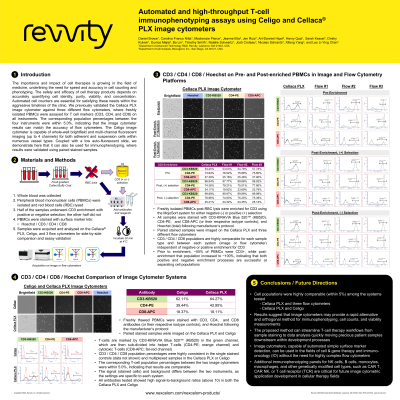
Abstract: The importance and impact of cell therapies is growing in the field of medicine, underlining the need for speed and accuracy in cell counting and phenotyping. The safety and efficacy of cell therapy products depends on accurately identifying cell identity, purity, viability, and concentration. Automated cell counters are essential for satisfying these needs within the quick timelines of the clinic. We previously validated the Cellaca PLX image cytometer against multiple flow cytometers (Beckman CytoFLEX, BD Fortessa, and Cytek Aurora), where freshly isolated PBMCs were assayed for T cell markers (CD3, CD4, and CD8) on all instruments. The corresponding population percentages between the four instruments were within 5.0%, indicating that the image cytometer results can match the accuracy of flow cytometers. The Celigo image cytometer is capable of whole-well brightfield and multi-channel fluorescent imaging (up to 4 channels) for both adherent and suspension cells within numerous vessel types. Coupled with a low auto-fluorescent slide, we demonstrate that it can also be used for immunophenotyping, where results were validated by comparing paired samples alongside the Cellaca PLX. Cryopreserved PBMCs were thawed and 1.0x10⁶ cells each were single- or multiplex-stained for CD3/CD4/CD8/Hoechst for 30 minutes at 4 ᴼC. In this surface marker assay, T-cells are marked by CD3-KB520 in the green channel, which are then sub-divided into helper T-cells (CD4-PE; red channel) and cytotoxic T-cells (CD8-APC; far-red channel). Cell concentration is determined using Hoechst, which permeates and binds to all cells containing DNA. Cells were washed and resuspended in cell culture media for imaging on the Celigo and Cellaca PLX. Over 20,000 and 10,000 cells in each well were analyzed on the Celigo and the Cellaca PLX, respectively. Population percentages were highly consistent in the single stained controls and the multiplexed sample. On the Celigo, CD3 positive cells made up 61.5-63.3% of total PBMCs, while CD4 positive cells ranged from 38.7-40.8%, and CD8 positive cells ranged from 18.2-19.0%. On Cellaca PLX, CD3 positive cells made up 64.3-66.5% of total PBMCs, while CD4 positive cells ranged from 42.1-43.5%, and CD8 positive cells ranged from 18.1-19.5%. The corresponding population percentages between the two image cytometers were within 5.0%, indicating that results are comparable. Image cytometers that are now capable of automated simple surface marker detection can be used in the fields of cell and gene therapy and immuno-oncology without the need for highly complex flow cytometers. Thus, the assay used here can potentially streamline T-cell therapy workflows while producing accurate and repeatable results.